
Asset allocation is the single most important tool for investors. According to a 1986 study, 93.6 percent of the variance found in 91 large pension plans’ quarterly  returns could be explained by Asset allocation The study was updated five years later and reached a similar conclusion, finding that 91.5 percent of quarterly return variance could be explained by allocation. Notwithstanding some counter arguments, PERA subscribes to the view that Asset allocation is a key factor in driving long-term returns. In fact, PERA’s Statement of Investment Policy reiterates an investment axiom: “strategic Asset allocation is the most significant factor influencing long-term investment performance.”
The allocation represents the proportion of a portfolio that is invested in stocks, bonds, real estate, and other assets. After evaluating the prospects for each of these asset classes based upon input from investment consultants and PERA investment professionals, PERA’s board arrives at a strategic target allocation, as well as a range for each asset (a range is allowed for market fluctuations).
To maximize risk-adjusted returns, investors seek an allocation that optimizes return while minimizing risk. To evaluate the trade-off of risk/return, some investors rely on tools from Professor Harry Markowitz’s Modern Portfolio Theory (MPT). MPT advocates a portfolio perspective, wherein all securities are combined and their proportionate contributions to risk and return are aggregated. Adding in the concept of “risk-free” assets (most commonly defined as 10-year US Treasury securities), investors are able to plot all available portfolios in a risk/return space called the efficient frontier. The efficient frontier is the set of theoretically available portfolios (pictured below).
Exhibit 1. Markowitz Efficient Frontier
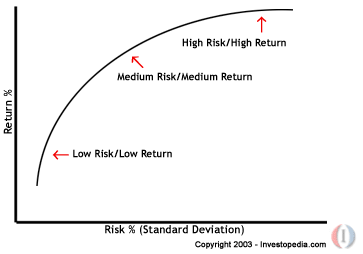
Source: Investopedia
The efficient frontier provides a tool to define the most appealing portfolios for a given level of risk (also called risk tolerance). This risk tolerance level is a driver that determines an investor’s optimal portfolio. Admittedly, this explanation is a dramatic oversimplification of MPT, but it provides a cursory level of understanding into PERA’s decision making process.
Every three to five years, PERA’s Board of Trustees, in conjunction with its investment consultant, reevaluates its strategic Asset allocation; the time horizon is industry standard due to the long-term capital markets perspective taken by institutional investors. The foundation of the Board’s Asset allocation recommendation is thoughtful analysis of both current and projected market conditions, changes in the relationship of plan assets and liabilities, the timing of projected cash outflows, and the plan’s risk tolerance. There is a lot to consider, and determining an Asset allocation recommendation is an incremental process.
The process begins by defining objectives and building a model that incorporates projections for inflation and interest rates. Inflation is estimated using published consensus figures. Another estimate uses the difference between yields of on-the-run treasuries and the yield on Treasury Inflation Protected Securities (TIPS), which is also called the break-even inflation rate. Interest rate projections are based on the median expected 10-year Treasury return for the upcoming period. These consider the Federal Reserve’s reaction to inflation, as well as other projected changes in monetary and fiscal policy. The Board will then analyze the capital markets and plot the options on the efficient frontier. This process helps quantify asset and liability risk and identify optimal investment strategies. Each asset class is evaluated based on the set of factors most germane to it.
The next step is to determine the plan’s risk tolerance. Risk tolerance is influenced by demographics, funded status, and cash needs, among many other factors.
The final step of the initial phase is analyzing liabilities using cost data, funded status, and sensitivities to changes in the input variables. For example, a portfolio designed to provide retirement income that is sensitive to wage inflation can benefit from equities, which are considered risk assets and therefore should generate returns that exceed inflation.
Throughout the process the proposed allocation will be evaluated and tested through a Monte Carlo simulation of the modeled assumptions. According to the CFA Institute:
Monte Carlo simulation allows us to experiment with a proposed policy before actually implementing it. For example, investment performance can be evaluated with reference to a benchmark or a liability. Defined benefit pension plans often invest assets with reference to plan liabilities. Pension liabilities are a complex random process. In a Monte Carlo asset-liability financial planning study, the functioning of pension assets and liabilities is simulated over time, given assumptions about how assets are invested, the work force, and other variables. A key specification in this and all Monte Carlo simulations is the probability distributions of the various sources of risk (including interest rates and security market returns, in this case). The implications of different investment policy decisions on the plan’s funded status can be assessed through simulated time.
Upon the conclusion of the asset-liability study, PERA’s Board will develop an optimal mix of investments.
PERA’s current Asset allocation, as adopted by the PERA Board of Trustees in January 2011, is:
Exhibit 2. Colorado PERA Asset allocation (effective 1/1/2011)
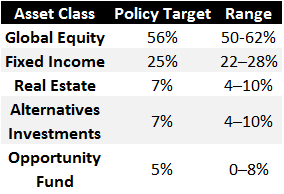
Source: Colorado PERA
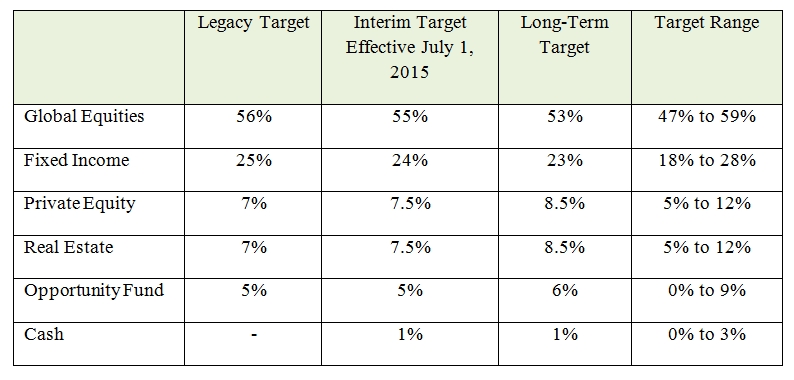
The PERA Board recently approved a new long-term strategic Asset allocation The process began in May 2014 when the Board, its executives, and investment team began working with the Board’s consultant to craft a thoughtful allocation strategy in light of the changing dynamics of the investment landscape.
The Board adopted a phased implementation plan that will reflect the new allocations as presented below in Exhibit 3.
Exhibit 3. Colorado PERA Asset allocation (effective 7/1/2015)
Asset classesA category of similar investments. Common asset classes include global equity (such as publicly traded stocks), real estate, and cash.Defined benefitAlso known as a pension, this is a type of pooled retirement plan in which the plan promises to pay a lifetime benefit to the employee at retirement. The plan manages investments on behalf of members, and the retirement benefit is based on factors such as age at retirement, years of employment and salary history.Asset allocationAn investor’s mix of stocks, bonds, and other investments. PERA’s strategic asset allocation is set by the PERA Board of Trustees.Asset allocationAn investor’s mix of stocks, bonds, and other investments. PERA’s strategic asset allocation is set by the PERA Board of Trustees.Asset allocationAn investor’s mix of stocks, bonds, and other investments. PERA’s strategic asset allocation is set by the PERA Board of Trustees.Asset allocationAn investor’s mix of stocks, bonds, and other investments. PERA’s strategic asset allocation is set by the PERA Board of Trustees.BenchmarkA tool used to measure performance. For example, an investor can use a stock index as a benchmark to measure his/her own investment performance compared to the market as a whole.Asset classA category of similar investments. Common asset classes include global equity (such as publicly traded stocks), real estate, and cash.Asset classA category of similar investments. Common asset classes include global equity (such as publicly traded stocks), real estate, and cash.


In view of the high volatility of world markets, I would think that to keep a pension fund solvent in the long run, PERA would need to flip-flop its investment strategy in the following categories to represent a more conservative stance. Typically, pension funds strive for a 4.5% return on investment to maintain longevity.
56% for Fixed Income rather than Global Equities
25% for Global Equities rather than Fixed Income
Isn’t the loss we incurred in 2007 enough?
Alida,
Thank you for your question.
As a long-term investor, the PERA Board carefully considers both risk and opportunity when determining the strategic asset allocation policy.
The median investment return assumption used by public plans is 7.75%. (PERA’s is 7.5%) See the National Association of State Retirement Administrator’s fact sheet on rate of return assumptions: http://www.nasra.org/files/Issue%20Briefs/NASRAInvReturnAssumptBrief.pdf
PERA’s asset allocation is representative of other large public plans as well: http://publicplansdata.org/quick-facts/national/
Reforms contained in 2010’s Senate Bill 1 returned PERA to long-term sustainability.
Katie Kaufmanis – Colorado PERA Public Information Officer
I find it interesting that you reference Senate Bill 1 as the reason for bringing PERA back to long-term sustainability. I believe it has more to do with the sacrifice PERA members made when Senate Bill 1 went into effect by reducing the annual COLA benefit to 2% than the reset of PERA’s rate of return assumptions. Let’s be honest and not add insult to injury.
I recently attended a PERA meeting and was told that PERA funding sits at 67% of promised benefits. I believe that Senate Bill 1 that increase contributions for employees and reduced COLA for Retirees and the rebound in the stock market all helped improve that number. My question is what percentage of funding does PERA believe to be acceptable and is the goal? I don’t believe it should be the taxpayers of Colorado that are expected to ever cover these shortages. PERA members are the ones that should ensure that our plan is self sustaining so I would like to know what are the goals to unsure we can meet the promised benefits.
Jodi,
The PERA Board of Trustees’ funding goal is 100 percent. Under the framework provided in SB 1 this is expected to be achieved with 90 percent of the burden on the membership – not the taxpayer.
Please see the post on the Strategic Plan for more details. https://peraontheissues.com/index.php/2015/01/09/colorado-peras-2014-2018-strategic-plan/
According to COPERA’s Annual Reports, the last time assets to accrued liabilities exceeded 100% was in 2000. The most recent online report (2013) cites a funded ratio of 61% based on the actuarial value of assets. Of course, between those two dates lay two severe market downturns. The current six-year robust market rebound has done little to close the gap—PERA is a big ship to turnaround.
The question is what will turn it around? I would characterize the target allocation described above as aggressive. While MPT and the Efficient Frontier may support such high risk, academic theory does not counter PERA’s real-world first-hand experience of what risky assets can do to a portfolio. The next market swoon will simply put a fully funded ratio further from reach.